


Since 1991, Transport Canada has recorded the dangerous goods (DG) incidents reported to it. The Government of Canada publishes the counts on its Transportation Data and Information Hub (TDIH). Read across 35 years, the line bends the right way.
How many dangerous goods incidents happen in Canada each year?
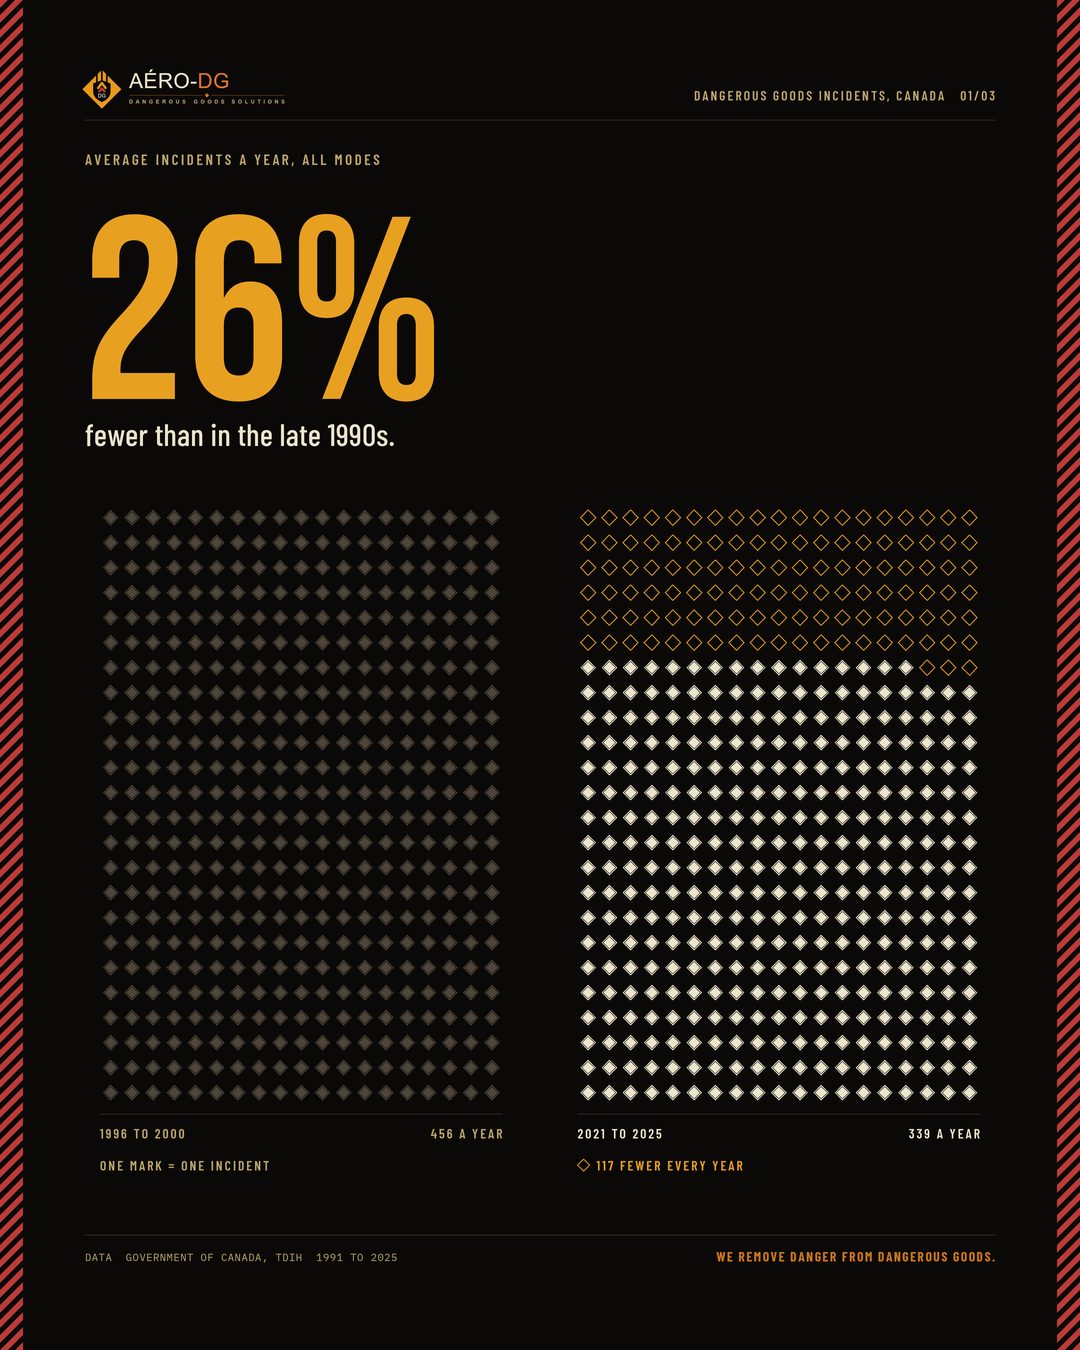
About 339 a year, based on the 2021 to 2025 average. The record peaked at 517 in 1996, and from 1996 to 2000 the country averaged 456 a year. That is roughly 117 fewer events every year.
Same timeline, separate scales. Air accounts for under 4% of incidents since 1991 (493 of 13,324), so on one shared scale its line would sit almost flat. Hover or tap any year for the full split by mode.
Show the numbers
| Year | Air | Road | All modes | Rail | Marine |
|---|---|---|---|---|---|
| 2025 | 3 | 287 | 332 | 40 | 2 |
| 2024 | 4 | 242 | 293 | 44 | 3 |
| 2023 | 11 | 291 | 344 | 38 | 4 |
| 2022 | 4 | 338 | 368 | 23 | 3 |
| 2021 | 9 | 291 | 358 | 52 | 6 |
| 2020 | 7 | 277 | 328 | 40 | 4 |
| 2019 | 4 | 376 | 448 | 66 | 2 |
| 2018 | 13 | 395 | 453 | 39 | 6 |
| 2017 | 14 | 351 | 400 | 32 | 3 |
| 2016 | 17 | 257 | 301 | 24 | 3 |
| 2015 | 11 | 288 | 332 | 27 | 6 |
| 2014 | 10 | 343 | 385 | 31 | 1 |
| 2013 | 17 | 317 | 393 | 58 | 1 |
| 2012 | 22 | 336 | 400 | 40 | 2 |
| 2011 | 23 | 289 | 345 | 33 | 0 |
| 2010 | 13 | 262 | 302 | 26 | 1 |
| 2009 | 9 | 275 | 327 | 42 | 1 |
| 2008 | 12 | 377 | 436 | 44 | 3 |
| 2007 | 17 | 340 | 428 | 69 | 2 |
| 2006 | 32 | 301 | 383 | 49 | 1 |
| 2005 | 17 | 306 | 386 | 58 | 5 |
| 2004 | 17 | 265 | 374 | 87 | 5 |
| 2003 | 18 | 238 | 359 | 100 | 3 |
| 2002 | 19 | 319 | 438 | 97 | 3 |
| 2001 | 22 | 314 | 432 | 89 | 7 |
| 2000 | 17 | 387 | 473 | 65 | 4 |
| 1999 | 22 | 350 | 476 | 98 | 6 |
| 1998 | 11 | 339 | 431 | 81 | 0 |
| 1997 | 20 | 311 | 384 | 47 | 6 |
| 1996 | 26 | 396 | 517 | 88 | 7 |
| 1995 | 14 | 245 | 335 | 71 | 5 |
| 1994 | 5 | 218 | 290 | 61 | 6 |
| 1993 | 5 | 192 | 242 | 44 | 1 |
| 1992 | 14 | 300 | 394 | 74 | 6 |
| 1991 | 14 | 328 | 437 | 90 | 5 |
Source: Government of Canada, Transportation Data and Information Hub (TDIH), Transport Canada data
Short-term swings are normal. In 2024 the total fell to 293, the lowest since 1994, and 2025 climbed back to 332.
Which transport mode improved most: air, rail or road?
Air, by a wide margin. All major modes now sit below their late-1990s levels, though the pace varies a lot.
Five-year averages. Marine is left out: it never exceeded 7 cases in a year, too few for a trend.
Show the numbers
| Mode | Average a year, 1996 to 2000 | Average a year, 2021 to 2025 | Drop |
|---|---|---|---|
| Air | 19 | 6 | 68% |
| Rail | 76 | 39 | 48% |
| All modes | 456 | 339 | 26% |
| Road | 357 | 290 | 19% |
Source: Government of Canada, Transportation Data and Information Hub (TDIH), Transport Canada data
Air made the biggest gain, from 19 cases a year to 6. Rail roughly halved, from 76 to 39. Road moved least, from 357 to 290, so its share of all incidents grew from 78% to 85%.
Road has the most dangerous goods incidents
Road carried 86% of the incidents recorded in 2025.
Separate Transport Canada tables on submode and cause show where this happens:
- In transit. 48% of road incidents since 1991 happened in transit rather than at a terminal, plant or other site. Since 2016, that share is 63%.
- Loss of control. The cause recorded most often, listed in 1,845 of 10,741 road incidents since 1991 (17%) and in 32% since 2021.
- Loading and handling. Improper loading, unloading or handling is a close second, at 1,821 (17%).
One incident can list more than one cause. Since 1991, road accounts for about 81% of every record in the series.
Which causes of dangerous goods incidents changed most?
The causes a shipper controls fell the most. Overfill, blocking and bracing, and loading problems all shrank as a share of incidents, while loss of control and road debris grew.
Rose most on road and rail: road loss of control (18% to 32%), rail obstacles or debris (4% to 18%), road obstacles or debris (6% to 19%). Fell most: air procedures not followed (39% to 0%), rail loading and handling (18% to 3%), road overfill (11% to 0%). Bar length shows the share of that mode's incidents that list the cause, from 0 at the inner edge; the dashed rings mark 20% and 40%. One incident can list several causes. The centre shows incidents a year across all modes; marine, under 7 cases a year, has no cause table here. Air's 2021 to 2025 shares rest on 31 incidents, so read them as direction, not precision. Hover or tap a bar for the numbers.
Show the numbers
| Mode | Cause | 1996 to 2000 | 2021 to 2025 | Change |
|---|---|---|---|---|
| Road | Loss of control | 18% (327 of 1,783) | 32% (469 of 1,449) | +14 points |
| Road | Obstacle or road debris | 6% (115 of 1,783) | 19% (270 of 1,449) | +12 points |
| Road | Loading, unloading or handling | 14% (256 of 1,783) | 10% (139 of 1,449) | -5 points |
| Road | Poor weather or road conditions | 4% (68 of 1,783) | 13% (192 of 1,449) | +9 points |
| Road | Blocking or bracing | 11% (198 of 1,783) | 4% (64 of 1,449) | -7 points |
| Road | Overfill | 11% (205 of 1,783) | 0% (2 of 1,449) | -11 points |
| Rail | Poor infrastructure | 18% (69 of 379) | 14% (27 of 197) | -5 points |
| Rail | Obstacle or debris | 4% (15 of 379) | 18% (35 of 197) | +14 points |
| Rail | Loading, unloading or handling | 18% (69 of 379) | 3% (5 of 197) | -16 points |
| Rail | Defective fittings or valves | 8% (29 of 379) | 8% (15 of 197) | -0 points |
| Rail | Valve failure | 10% (39 of 379) | 4% (8 of 197) | -6 points |
| Rail | Loose fittings or valves | 4% (17 of 379) | 5% (10 of 197) | +1 points |
| Air | Loading, unloading or handling | 30% (29 of 96) | 23% (7 of 31) | -8 points |
| Air | Procedures not followed | 39% (37 of 96) | 0% (0 of 31) | -39 points |
| Air | Blocking or bracing | 11% (11 of 96) | 6% (2 of 31) | -5 points |
| Air | Electrical failure | 0% (0 of 96) | 16% (5 of 31) | +16 points |
| Air | Undeclared or misdeclared | 0% (0 of 96) | 16% (5 of 31) | +16 points |
| Air | Combustion | 0% (0 of 96) | 10% (3 of 31) | +10 points |
Source: Government of Canada, TDIH (Transport Canada data): road, rail and air incidents by cause, and incidents by mode
What counts as a reportable dangerous goods incident?
Under Part 8 of the Transportation of Dangerous Goods (TDG) Regulations, the person in charge of the means of containment must report a release, an anticipated release, a loss or a theft. That duty applies when the quantity tops the limit set in the Regulations and the event endangers, or could endanger, public safety. Reports go to CANUTEC, Transport Canada's emergency response centre for dangerous goods.
What the dangerous goods incident data does not show
- Counts, not severity. A minor weeping paint can and a catastrophic tanker rollover each count once.
- Small samples. Air and marine record only a few cases a year, so a swing of a few cases can tilt a trend.
How shippers can prevent dangerous goods incidents
By checking five things before freight leaves the dock. Many incidents trace back to how a shipment was prepared, and those controls sit with the shipper.
- ClassifyThe right UN number, class and packing group, confirmed against the Safety Data Sheet.
- PackPackaging that meets the rules for the goods (UN-specification where required), closed exactly as the maker specifies.
- Mark and labelPlaced as each mode requires: TDG Regulations on the ground, IATA DGR in the air, IMDG Code at sea.
- DocumentA complete, accurate shipping document or Shipper's Declaration.
- TrainAnyone who prepares or handles the load holds current training for it.
For hands-on help, our dangerous goods packing services cover classification, packing, labels and documents.
Frequently asked questions
How many dangerous goods incidents did Canada record in 2025?
A total of 332: 287 on the road, 40 by rail, 3 by air and 2 marine, according to Government of Canada data on TDIH, collected by Transport Canada.
Are dangerous goods incidents in Canada going down?
Yes, over the long run. The 2021 to 2025 average of 339 a year sits about 26% below the 1996 to 2000 average of 456. Single years still swing: 2025 rose 13% on 2024.
Where can I find official Canadian DG incident data?
Transport Canada collects the reports, and the Government of Canada publishes them on the Transportation Data and Information Hub, with tables from 1991 onward.
How we analyzed the data
We downloaded the TDIH table "Number of dangerous goods incidents recorded by mode". We confirmed that each year's modes add up to its total and rounded averages to whole numbers. All figures on this page come from that table.